Finance Terms
What is a Balance Sheet?
See video transcript
A balance sheet is a financial statement that provides a snapshot of a company's financial position at a specific point in time. It presents a structured summary of a company's assets, liabilities, and shareholders' equity. Prepared at regular intervals, such as quarterly or annually, the balance sheet is one of the three core financial statements—along with the income statement and the cash flow statement—used to evaluate a business's performance. For companies listed on public stock exchanges, the release of these statements is a mandatory quarterly requirement.
The foundation of the balance sheet is the accounting equation, a simple yet powerful formula:
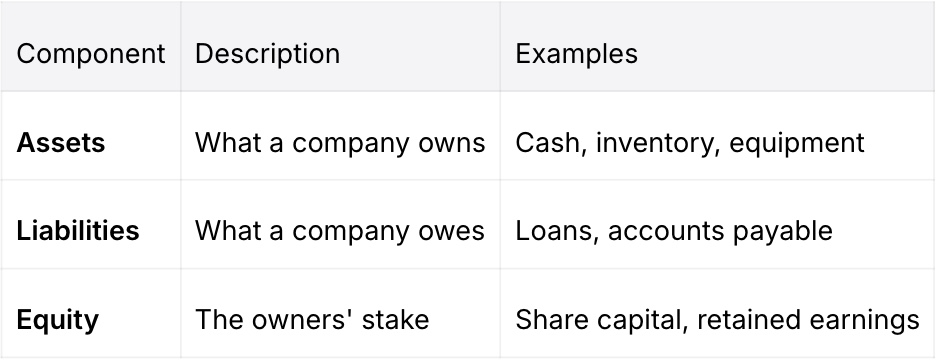
Assets = Liabilities + Equity
This equation demonstrates how a company's resources (assets) are financed, whether through debt (liabilities) or ownership capital (equity).
Assets represent all resources with economic value owned by a company. They are listed on one side of the balance sheet and are categorized based on their liquidity.
These are assets that can be reasonably expected to be converted into cash within one year. Examples include cash, accounts receivable, and inventory.
These are long-term assets not expected to be converted into cash within a year. They include property, plant, and equipment (PP&E), as well as intangible assets like patents and trademarks.
Liabilities are a company's financial obligations to other parties. They appear on the other side of the balance sheet, opposite the assets.
These are obligations due within 12 months, such as accounts payable, accrued expenses, and short-term debt.
These are long-term obligations that are not due within one year. Examples include long-term bonds, mortgages, and pension obligations.
Shareholders' equity signifies the owners' residual claim on the company's assets after all liabilities have been settled. It is the company's net worth. Equity is calculated by subtracting total liabilities from total assets and includes components like share capital and retained earnings (accumulated profits reinvested into the business).
Assets are bifurcated based on liquidity.
These are vital for funding day-to-day operations and satisfying short-term debts. They include cash, marketable securities, accounts receivable, and inventory.
These represent a company's long-term investments and are essential for its operational capacity. These include land, buildings, machinery, and intangible assets like goodwill.

Liabilities are also categorized by their due date.
These are short-term obligations due within one year, including accounts payable, payroll expenses, and the current portion of long-term debt.
These refer to long-term financial obligations with a maturity of more than one year, such as bonds payable and long-term loans.
Shareholders' equity represents the capital invested by the owners. Its main components are:
Funds raised from issuing shares of stock.
The amount investors paid for shares above their par value.
The cumulative net profits that a company has reinvested in the business rather than distributing as dividends.
A positive equity value indicates financial stability, whereas a negative value may signal impending insolvency.
Liquidity ratios measure a company's ability to meet its short-term obligations using its current assets.
Compares total current assets to total current liabilities.
Similar to the current ratio but excludes inventory from current assets for a more stringent test.
The most conservative ratio, comparing only cash and cash equivalents to current liabilities.
Liquidity ratios show if a company can meet short-term debts with its assets. A ratio above 1.0 signals stability, while below 1.0 warns of potential cash flow issues. Very high ratios may also mean assets are not being used effectively. These measures help assess financial health and risk.
Solvency ratios assess a company's ability to meet its long-term debt obligations, providing insight into its financial leverage and stability.
Measures the proportion of a company's assets financed through debt.
Compares total debt to shareholders' equity.
Evaluates a company's ability to pay interest on its outstanding debt.
Lower debt ratios and a higher interest coverage ratio typically signify better financial health, though benchmarks vary significantly by industry.
Efficiency ratios measure how effectively a company utilizes its assets and manages its liabilities to generate revenue.
Indicates how many times a company's inventory is sold and replaced over a period.
Measures how efficiently a company collects revenue from its customers.
Assesses how effectively a company uses its assets to generate sales.
Higher turnover ratios generally suggest superior operational efficiency, as they show how effectively a company uses its assets to generate revenue. Strong efficiency ratios can indicate better inventory management, faster collection of receivables, and optimal use of resources, all of which contribute to stronger profitability and competitiveness.
To derive deeper insights, a vertical analysis can be performed by expressing each line item as a percentage of total assets. This facilitates comparison across different periods or against industry competitors. Significant changes in these percentages over time can highlight areas of strength or potential concern. This analysis provides a quantitative basis for strategic planning, budgeting, and informed decision-making.
To simplify a balance sheet for analysis, apply the following structured approach:
Enhancing the transparency and usability of financial statements involves several best practices:
Breaking down a balance sheet requires a systematic review of its principal components:
The balance sheet must always adhere to the core accounting equation, where total assets are equal to the sum of liabilities and shareholders' equity.
Balance sheet accounts are organized with precision:
Within both assets and liabilities, categories are further divided into current (short-term) and non-current (long-term) classes, facilitating a clear assessment of financial position and maturity profile.


